Learn Power BI
This powerful collection of software, apps, and services will help you analyze your organization’s data and uncover insights and trends. This course will show you how to link and model data in Power BI and create visual reports that reveal data insights.
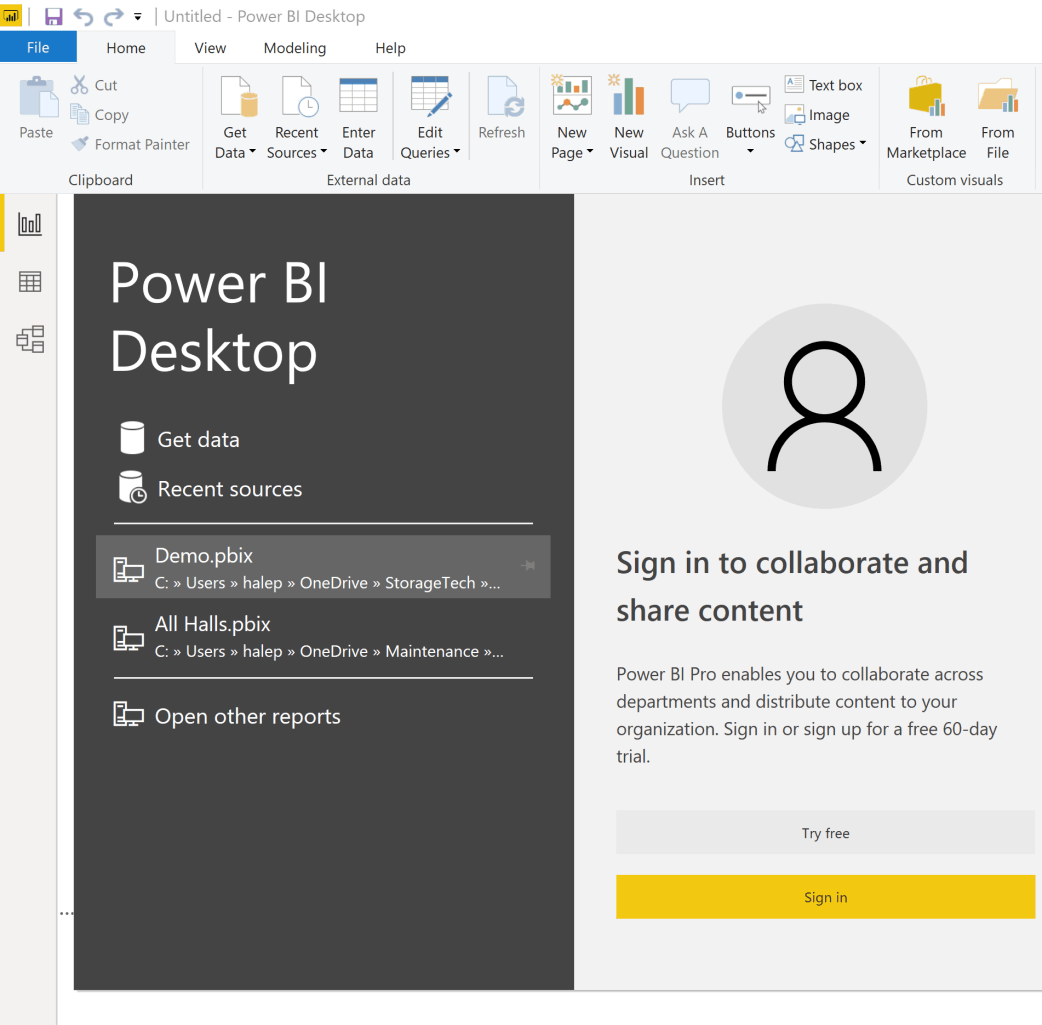
Getting Started
Describes the components of Power BI, and students will learn how to work with Power BI files, connect to data sources with the Power BI desktop clients, create a report and visualizations and work with visualizations.
Working with Data
This lesson covers how to transform and sanitize data, use the query editor, model data and manage relationships.
Working with Reports and Visualizations
Next, we will look at managing report pages, changing report view options, working with visualizations and their data and adding static objects to a report.
A Closer Look at Visualizations
This lesson is all about creating and managing visualizations. The types of visualizations covered are Matrixes, Tables, Charts, Maps, gauges, Cards, KPIs and Slicers.